Tag Archive for CO-PA

How does SAP Profitability Analysis meet the future demands for profitability reporting?

In this blog I will look at how the capabilities of SAP CO-PA to meet the current and future demands for profitability reporting. I will also touch upon its limitations.

During my time as a Financial Controller I was fascinated by the way in which SAP CO-PA provided the ability to analyse profitability (or more correctly, contribution) down to customer and product. It was a very powerful analytical tool within an ERP solution and it definitely sold SAP to me. Then I moved into consulting, and continued to extol the virtues of SAP CO-PA to my clients, but began to see that clients needed even greater granularity, particularly by being able to analyse profitability down below contribution.

SAP CO-PA has various tools within its repertoire to enable some form of profitability analysis.

Highly integrated module provides instant contribution analysis by key characteristics

When you have costing based SAP CO-PA active and configured in your SAP ERP system, as soon as a billing document is posted into your FI ledgers (General Ledger and Accounts Receivable), statistical postings are also made within the SAP CO-PA ledger.

These postings into SAP CO-PA relate purely to the P&L entries and are directly associated with the pricing conditions used within the billing document, so will usually consist of values relating to things like:

  • Sales volumes
  • Gross Sales value
  • Discounts

In addition, where you have pricing conditions which post standard costs of goods sold (from the Product Costing module) to your General ledger at the time of your billing document posting, these can also post to your SAP CO-PA ledger as Costs of Goods Sold, with values such as:

  • Variable costs
  • Fixed costs
  • Direct labour costs

So there is a high degree of integration between SAP CO-PA and your Sales (SD) module, as well as other modules within SAP, which provides a robust analysis solution easily reconciling between your financials and your sales results.

These statistical postings are saved against a combination of characteristic values allowing analysis using basic “slice & dice” reporting.

Standard, pre-delivered characteristics include:

  • Customer
  • Product
  • Customer group
  • Division
  • Distribution channel
  • Sales organisation
  • Ship to party

In addition many more characteristics can be defined to meet your specific requirements, provided that their values can be derived from existing data or through defined rules.

This enriches your Revenue and Cost of Sales data significantly from that which is generally available within the General Ledger.

Further values can be calculated within SAP CO-PA such as commission, and a provision for bad debt on individual sales. These values are calculated using rules similar to those used in the Sales module of SAP, where you can define percentages or fixed amounts with reference to other values already posted from the billing document.

As these values are purely available within SAP CO-PA reporting and are not posted within the General Ledger, there is no impact upon your statutory reporting.

Periodic settlement of costs

In addition to revenue and costs being posted into SAP CO-PA in real time at the time of billing, you can also settle other costs which are not directly associated with a billing document (pricing) postings on a periodic basis.

These are also “statistical postings” as the true postings continue to be made in the General Ledger.

These types of settlements can for example:

  • Allow you to calculate and report upon Work in Progress for long term contracts.
  • Incorporate production process variances into your profitability analysis.

Periodic allocations of indirect costs

Using SAP CO-PA assessment cycles allows you to allocate indirect costs, which are primarily captured on cost centres to characteristics such as product and customer on a periodic basis.
Apportionment methods such as statistical key figures, fixed values and percentage splits can be used

The combination of these different methods can build up your Profit and Loss statement by using different slice/dice combinations which can be a powerful analysis tool, enabling you to analyse your various types of segmental results.

Ability to transfer data to SAP BW

For reporting, as well as being able to report in ERP directly, standard SAP BW extractors and models can easily be enhanced to capture your own defined characteristics and value fields, which provides the ability to use all of the BW reporting tools and also utilise SAP BusinessObjects reporting, with minimal effort.

In addition, this reduces the performance impact of running high volume reports within your OLTP system.

Planning with SAP CO-PA

SAP CO-PA provides some limited basic planning functionality within SAP ERP, however it can provide summary data to seed SAP’s Business Planning and Consolidation (BPC) application. If you have a NetWeaver implementation of SAP’s BPC, then you can take advantage of the ability to utilise the enhanced standard BW extractors and models for SAP CO-PA to feed the SAP BPC planning model.

Summarisation levels

To speed up reporting, user defined summarisation levels can be created.

These summarise certain characteristics which may not need to be reported upon every time, for example, you may not want to always report down to “ship to party”, and so you can exclude that characteristic from the summarisation level, to reduce the number of records to report against.

These tables can be used in both SAP ERP and SAP BW reporting.

You can create and maintain multiple summarisation levels, which allow reports to be pointed at the most appropriate ones for performance purposes.

In addition the facility to “Re-align” the historical data if you want to re-state anything – say moving a customer from one group to another…

SAP CO-PA on HANA

A fairly recent innovation has been the option to harness the SAP HANA platform for CO-PA.
There are currently two main options available on general release:

SAP CO-PA Accelerator

This option uses the SAP HANA appliance as a secondary database for SAP CO-PA.SAP CO-PA data is replicated into the in-memory application which is then read by the CO-PA application within ERP to:

  • Execute reports
  • Display line items
  • Run cost centre assessments to SAP CO-PA
  • This is a plug and play solution, which is as non-disruptive to the users as possible.

BI reporting on SAP CO-PA data in HANA

This option takes the data from CO-PA and replicates it within SAP HANA, where it can be accessed via BW for reporting.

There is no access to the HANA data from the CO-PA module in SAP ERP.

SAP Business Suite powered by SAP HANA

Earlier in January 2013, SAP announced the availability of SAP Business Suite powered by SAP HANA becoming available for Business Suite customers.

This is an option which makes the enhanced performance of using the SAP HANA platform for CO-PA available directly within the business suite.

Words of warning

It is often seen that performance can be impacted with large assessment cycles (for the allocation of indirect costs) which have to be run at critical times of the month.

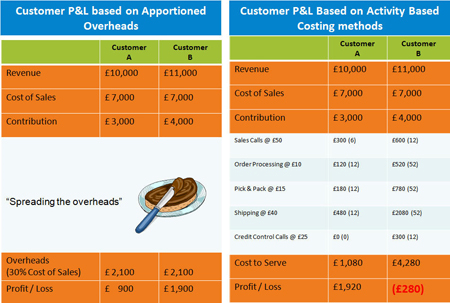
It is important to recognise that you will be using a “spreading” methodology for allocating your indirect costs with CO-PA, rather than the more robust and accurate Activity Based Costing methodology which is used with other tools.

If you take a manufacturing example, although the direct costs captured in the manufacturing process are most likely to be accurate, overall profitability reporting falls down with the capture and allocation of indirect costs/cost to serve is usually simplified, and is largely performed using forms of apportionment (related to Cost of Sales or Revenue for example), which leads to inaccurate results.

This is most likely due to the nature of indirect overheads, which are complex and time consuming to allocate in a more scientific manner.

YES – CO-PA can analyse profit at various levels by customer and product – but it isn’t so good with high volumes of customers or products – for example in the retail space, as its calculation engines are unwieldy within the OLTP environment.

This can be overcome to some extent by utilising CO-PA on the HANA platform, especially for the gross margin analysis.

YES – CO-PA can apportion indirect costs to customers and products – by using apportionments based on cost of sales or revenue for example, but this can skew the profitability and it is questionable just how much this adds value.

So, to summarise, SAP CO-PA is excellent at being able to provide summary profitability analysis to contribution level, but when you drop below there, you start to lose the accuracy you really need to be able to make business decisions based on it.

Can SAP CO-PA help with future demands for profitability reporting?

The answer to this is an emphatic YES!

SAP CO-PA can capture an enriched set of characteristic values and directly associated revenues and costs at the time of posting a billing document.

Its well documented reporting performance issues with large volumes can be alleviated by utilising the very powerful HANA platform.

SAP HANA can also help with periodic allocation performance, provided your business does not wish to use complex allocation methodologies.

If you consider SAP CO-PA as your initial base data capture for gross margin analysis, you can then complement this along with additional costing and simulation tools such as SAPs Profitability and Cost Management, to provide you with a robust, scalable and intuitive profitability analysis solution.

SAP CO-PA can also provide a great basis for sales planning/forecasting as it will hold many characteristic values which are relevant for sales.


Are you able to analyse true profitability

True profitability? Equitable overhead allocations?

Whilst working as a Financial Controller, I was often asked to identify our least profitable products and services and analyse why they were poor performers. This gave me quite a headache as the analysis had to be performed off-line using spreadsheets and complex calculations over masses of data which inevitably took forever to reconcile.

Once the analysis was done, I was then asked to drill down into the detail, which was impossible with the tools I had available. It’s fair to say that this was one of my most frustrating tasks.

This was one of my most frustrating tasks.

When I moved into business consulting, I found that this was a very similar story with all of the businesses that I worked with.

The use of SAP’s CO-PA module certainly sped up the analysis and breakdown, but when it came to getting to “true profitability” of a product or service, CO-PA’s limitations became clear to me.

Certainly, the analysis of gross profit by a multitude of characteristics such as customer, product, service type, region, brand, etc. became much easier to reconcilable with the use of SAP CO-PA, but when we tried to allocate indirect costs to the same characteristics, we found that we were skewing the results.

The impact of activity based costing

Activity Based Costing

If you look at the example above, the left hand table shows the results when you are using CO-PA apportionment methods, whereas what you really want to see are the results on the right!

What about the horror stories of trying to implement ABC?

I then came across an activity-based management tool back in the early 2000’s which a client of mine invested a lot of time and effort in implementing.

Unfortunately, this took the guise of a huge black box which no one, excepting the consultant who had designed and implemented it really understood! (I guess many of the readers of this will have had some similar experiences that they try hard to forget).

This meant that the solution quickly fell into disrepute, because no one could reconcile the results thrown out by it and it was very costly to maintain.

Following that experience, I personally decided that ABC had a very poor benefits case due to:

  • The nature of the data it required from day one
  • The maintenance efforts
  • The impossibility of reconciliation of the results
  • The length of time it takes to run the allocations on a regular basis

So, what changed MY mind?

When SAP acquired BusinessObjects it included a niche product called Profitability and Cost Management which instantly interested me as a potential solution for this missing functionality.

When I investigated further, it seemed to have answers to the negative points I cited earlier:

  • Can work at any level you have the data for, so you can increase complexity as you become more mature in your requirements
  • Owned and administered by Finance, with very friendly visual user interface
  • Full trace-back of results from source posting through to end allocation
  • Real time “in-memory” solution means it can cope easily with large volumes of data.

New way using SAP

Can this help with planning for future growth?

Yes! I recently worked with a client to take the closed loop process one step further by using a combination of SAP ERP CO-PA actual data and SAP PCM allocations to clearly and regularly analyse true profitability at a granular level never before available, other than using time consuming manual processes.

Moving forwards, the next step will be to integrate SAP PCM allocations into the planning cycle using “pre-allocation” data from SAP BPC and running it through the SAP PCM model to do the calculations, thus allowing SAP PCM to do what it is good at – calculating large volumes of allocation data, and leaving BPC to concentrate on what it is good at – being a planning tool, not a calculator!

The importance of profitability reporting and analysis


The key to a successful business is long term profitability. You may have huge sales volumes, but if you are selling at a loss, then your business will quickly fail.

But what is true profitability?

It is not just the value of the sale less the direct costs of that sale – for example in manufacturing, you can see a gross profit figure which is calculated by taking the sale, less the costs of the raw materials making up the end product you are selling,

There are also labour costs associated with “converting” those raw materials into the finished product and adding that extra value.

In addition there are the overheads of where that product is manufactured – such as the energy used to manufacture the product – these are variable and are determined by the volumes of product manufactured.

There are also fixed overheads which include the rent of the property etc which do not change whatever the volume of product is made.

  • Then you have the administration costs
  • The distribution costs
  • The capital costs (of any equipment used to manufacture)
  • Any discounts offered to customers
  • The cost of offering some form of credit to customers (your 30 day / 60 day terms)
  • Etc, etc…….

All of these costs need to be taken into consideration when looking at a business’s profitability. “That’s nothing new” I hear you cry! – “of course we need to consider all of these costs…. That’s what my P&L shows me!”

In the good times, you can get away with a summarised view of profitability, which is effectively that which is shown in your statutory accounts, but when you start to see margin erosion, what do you focus your efforts on?
Usually you will find this big black box which are your accounts, many customers, products, etc but how do you know which are profit makers and which are draining away your profit?

The time to act to get a better handle on your profitability is when your business is in a strong place – don’t wait for when you start to get pressure from your investors / banks to improve those margins.

Historical traits

More traditionally, business would look at reducing overheads – “slice off 5% of costs across the board”, “reduce headcount at head office by 500, because they can’t be adding any real value to our business” are the sorts of themes which are often repeated and heard over and over again in business situations where they are going through a sticky patch and come up with a knee jerk reaction.

However – the true culprits can often be products which are expensive to make and / or distribute, and customers that have a high cost to serve.

These can often be customers which have been with the business for a long time and products which are old favourites – each of which would be regarded with some sentimentality and the “gut feel” that they have “always been good for our business” – often needing to be looked at in a more scientific manner.

How to change behaviours?

This is where the analysis of your profitability becomes very important. You need to consider what level of analysis is appropriate for your business, the complexity of that analysis and the time and effort spent to produce the analysis v’s the benefits which will be forthcoming.

There also needs to be a clear direction that although the analysis is not 100% accurate, it is accurate enough to enable decisions to be made which are balanced and enlightened.
It is really important not to get bogged down in the detail, but be able to select a correct level of analysis, otherwise you will find yourselves spending more time analysing, rather than running your business.

  • Firstly you should look at what granularity of data is being captured via your sales process. You may find in a manufacturing business using SAP Product Costing, that you are capturing both the sale and direct cost of the product at product level, and also at customer level, but any other direct costs such as discounts etc are held just at customer level.
  • Then you have the other overheads – Can any of these be assigned directly to certain products or customers? Is there a fair way of allocating some of them to certain segments / brands?
  • You may find that a certain team of people only work with one brand – in that case, it is reasonable to assign their costs – salaries, office costs, expenses directly to that brand. However this should be done with caution, because if there are other brands in your portfolio that do not have similar costs assigned to them you will get an unfair view of their profitability.

Looking at a service based business, the cost to serve customers becomes more important, and how to allocate resources which are used cross customer / cross product/ brand in an equitable fashion can often be a real headache.

It is often wise to start with looking at where the largest percentage of your costs are – so in manufacturing this could be your cost of raw materials, or your cost of conversion such as labour costs or the cost of that new bit of equipment (both depreciation and maintenance).

Distribution / haulage costs can often be high and overlooked. If you are working in a service based business, it is likely that your people costs are one of the biggest areas of expense, in addition to perhaps property costs.

Once you have been able to identify an equitable way to split these major costs across your main segments/brands/customer channels, you are on your way to starting to get to grips with where your business makes its profits, and whereabouts your profits are eroded.

How have others overcome these challenges?

I have worked with SAP products for well over 15 years now, initially as a Financial Controller, trying to interpret the results I was given from FI/CO modules through to a consulting role, all focused on improving the transparency of financial reporting to support better business decision making.

Within the SAP portfolio of applications, there are numerous solutions available to enable this type of profitability analysis and reporting, ranging from the modules in SAP ERP such as Profit Centre accounting and CO-PA through to the Enterprise Performance Management suite including the Profitability and Cost Management application.

Each business has its own challenges and is at a different stage along the road of understanding its profitability. It is important to choose the right combination of the applications available to you, to get the right solution for your business and ensure it is scalable and future proofed, so that as your businesses profitability analyses requirements become more astute, your IT solutions keep up with minimal re-work.

Final thoughts

I personally do not think that a single SAP application will provide a complete profitability reporting and analysis solution, but I do think a clever combination of them will give a good level of transparency to allow educated business decisions to be made.